Resident population · Romania
Population in Romania, county by county: three censuses
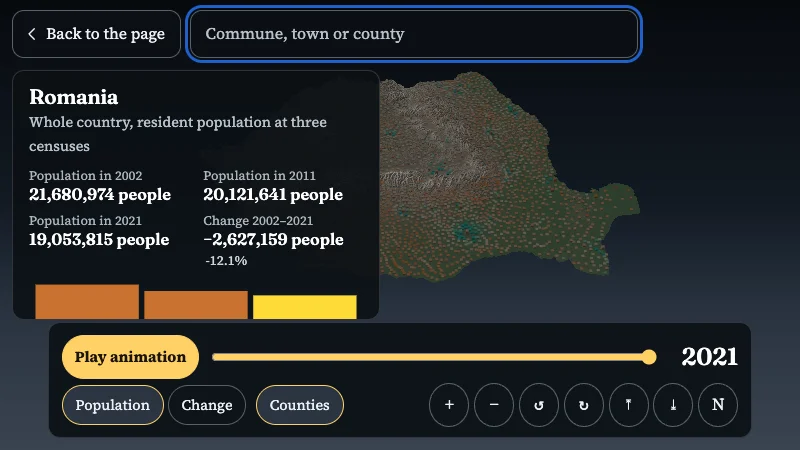
Choose a county on the map or in the list. Compare resident population across three censuses, then see how the picture changes when you look at percentages, not only totals.
All population projects ↓INS · censuses 2002 / 2011 / 2021
Where did the total rise or fall?
Alba
- 2002
- 382,747
- 2011
- 342,376
- 2021
- 325,941
- Net change
- -56,806
Resident population counts people usually living in the unit. Totals alone do not show why they changed.
The comparison covers 41 counties and Bucharest, using today’s administrative units. The map colours percentage change from 2002 to 2021; bars compare totals from the three censuses. The source does not flag boundary changes for each unit separately. Resident population in the 2002, 2011 and 2021 censuses. County values come from public citypopulation.de tables citing INS censuses; Bucharest is one total, with no separate sectors. The change does not explain why population shifted. Census tables used.
01 / Population in context
Three censuses, one question
The comparison uses resident population in the 2002, 2011 and 2021 censuses. Select an administrative unit to see all three totals. Bucharest is one of the 42 rows; its sectors are not added separately here.
02 / Population in context
A changed total does not tell us who moved
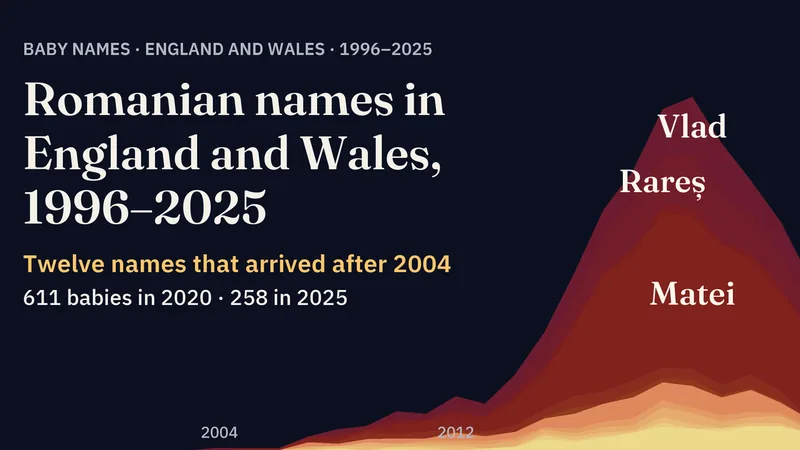
The difference between two censuses is a net change in resident population. It does not separate births, deaths or moves between places and countries. For migration, see projects that trace departures, arrivals and destinations through dedicated sources.
03 / Population in context
Births and ages need different denominators
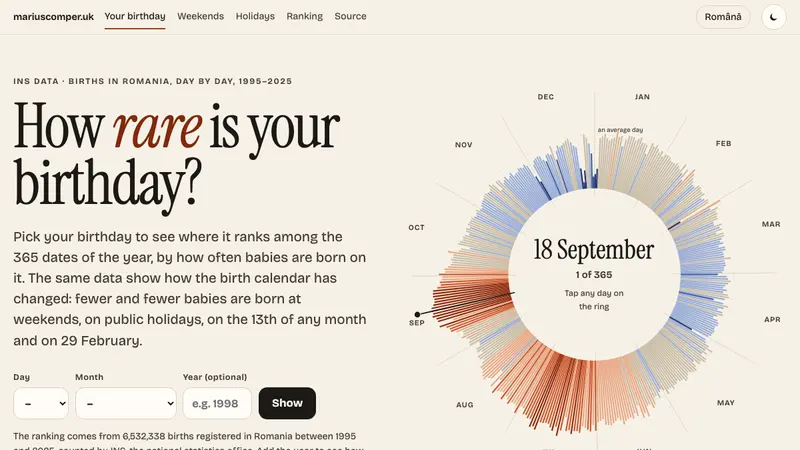
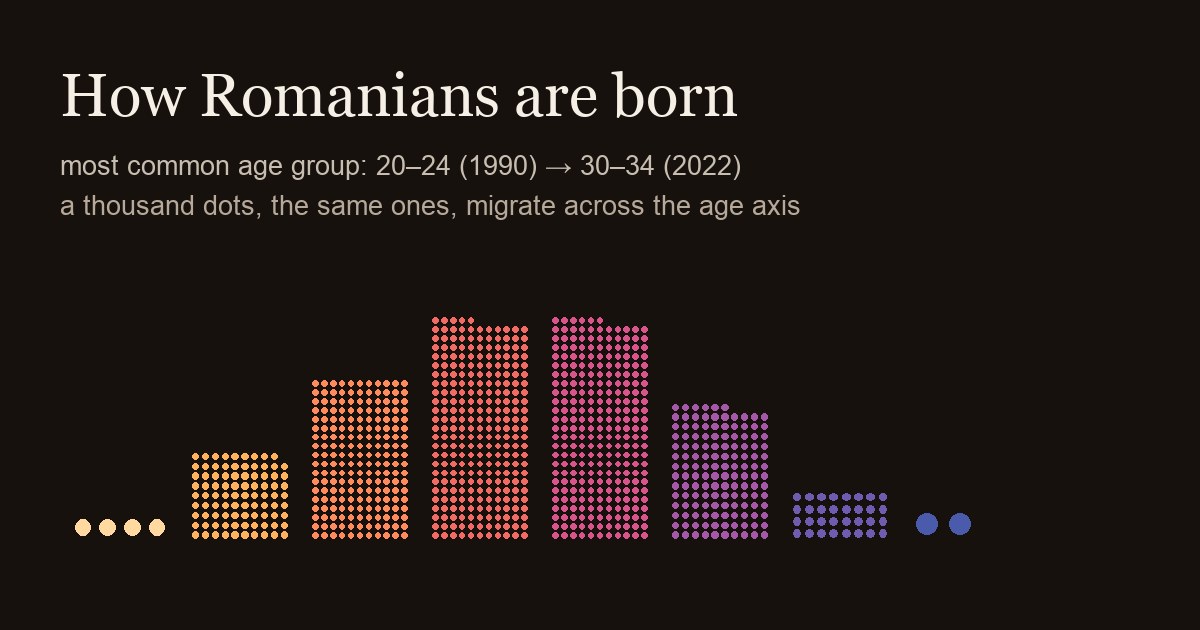
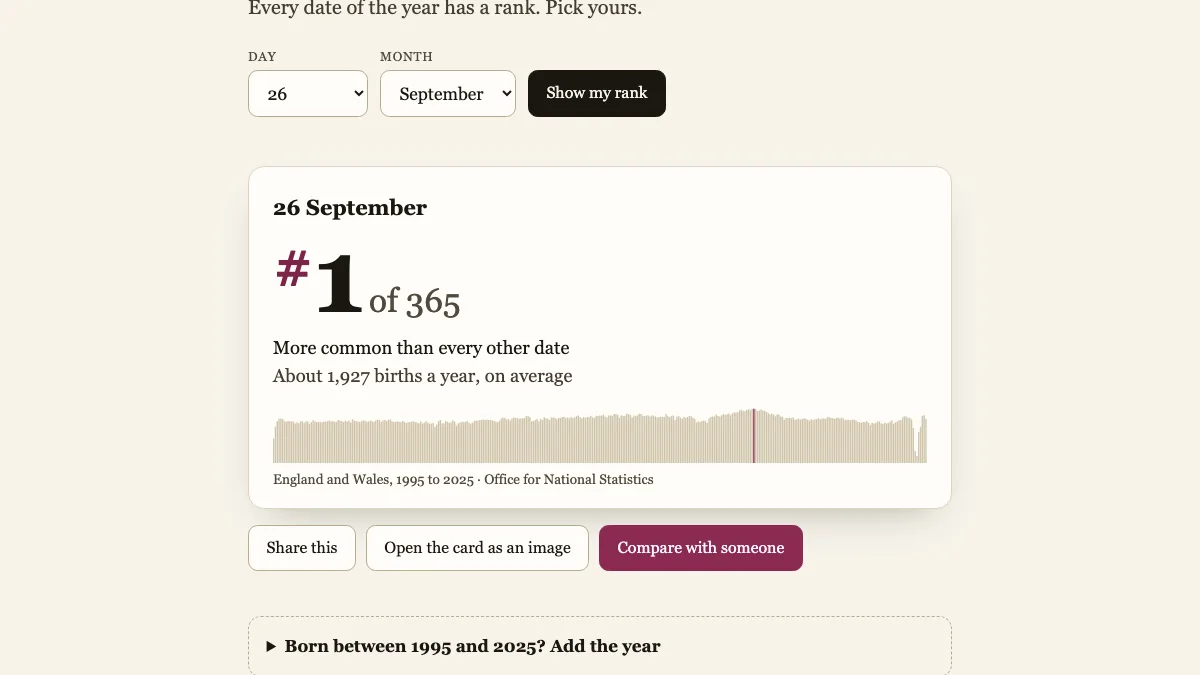
A count of births in one year is not the same as a birth rate; the age distribution of mothers alone does not describe a family’s decision. Open the birth series, birthday records and regional projections to see the period and population behind each measure.
04 / Population in context
People, homes and administrative boundaries
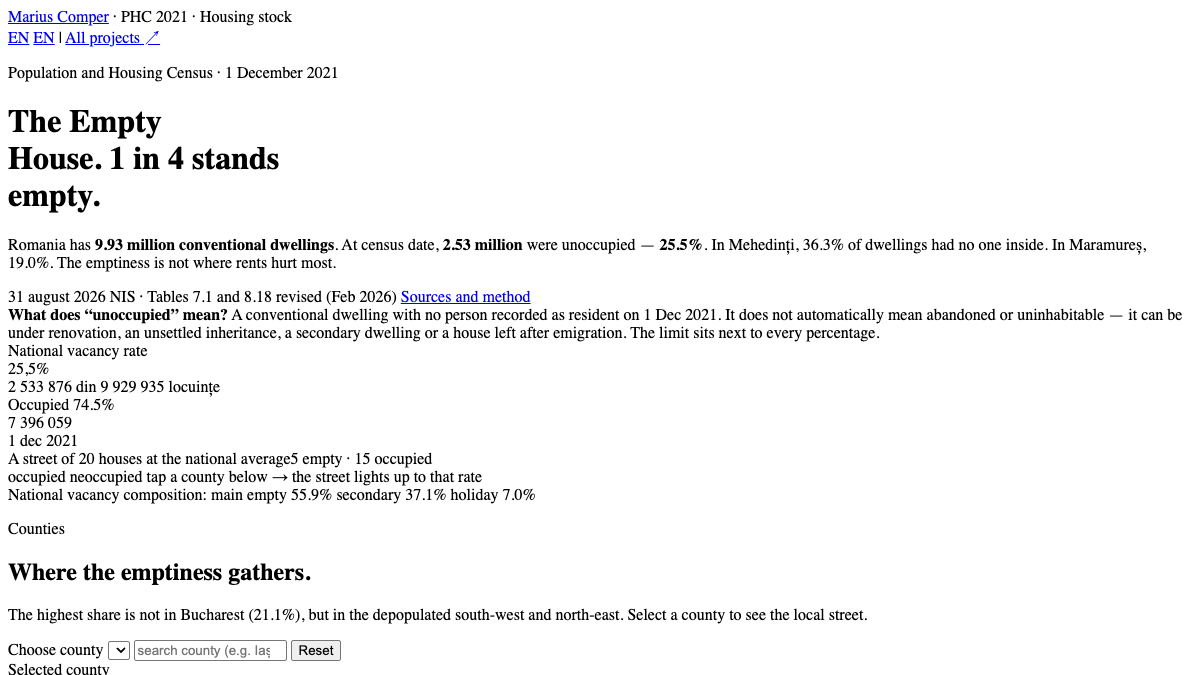
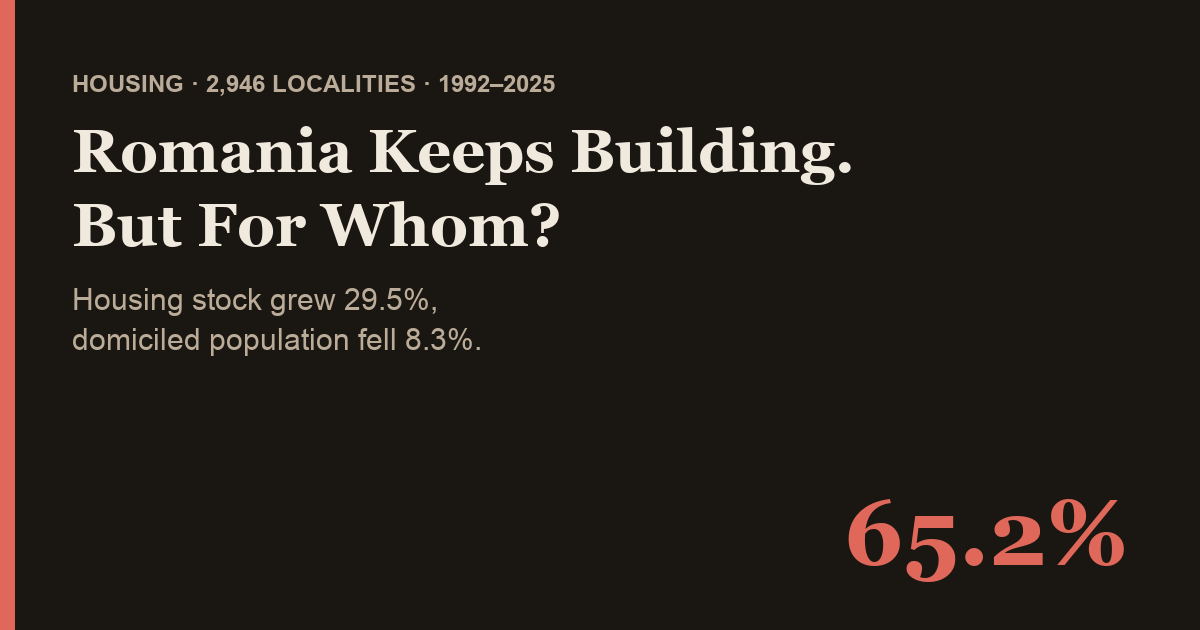
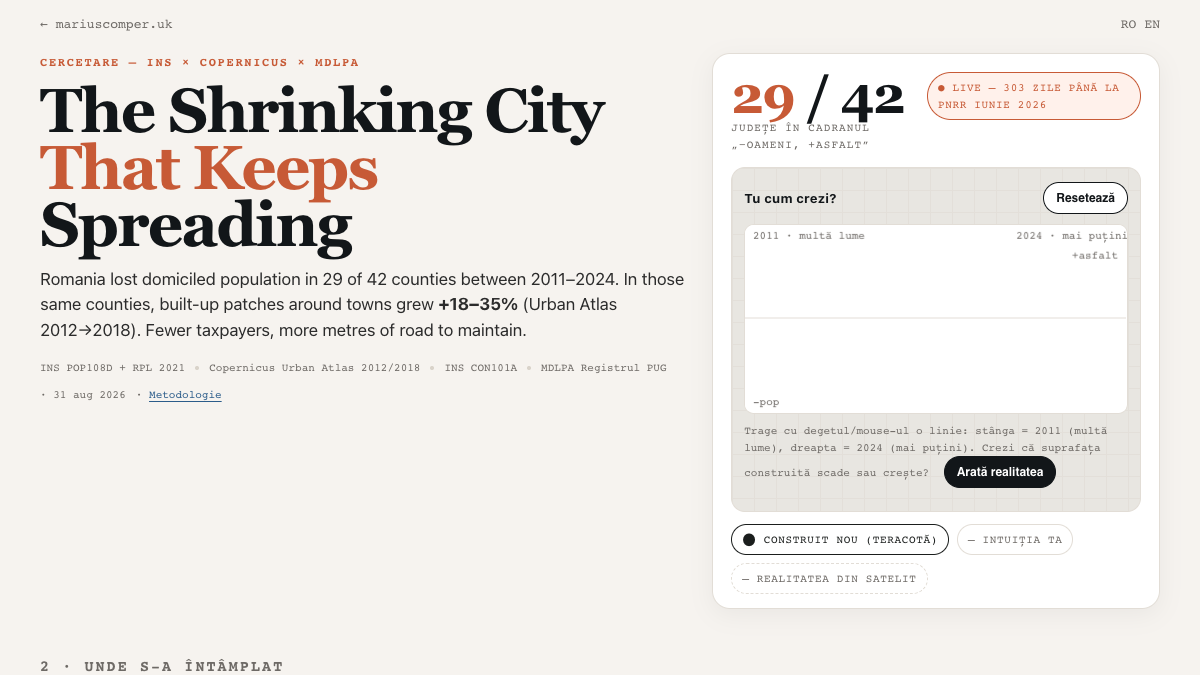
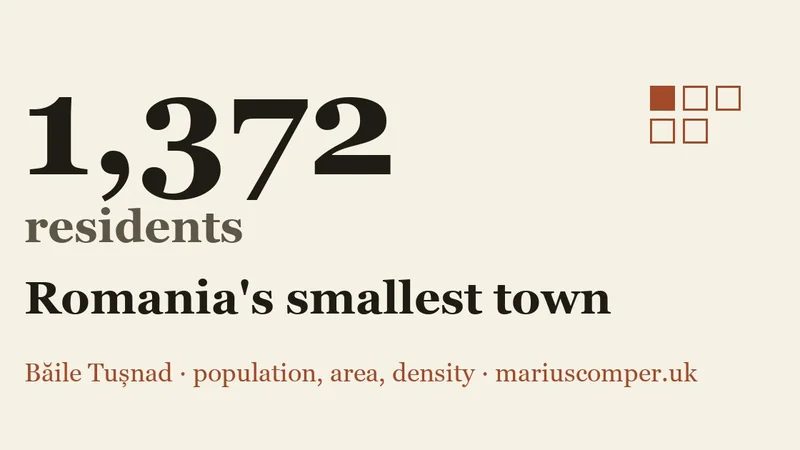
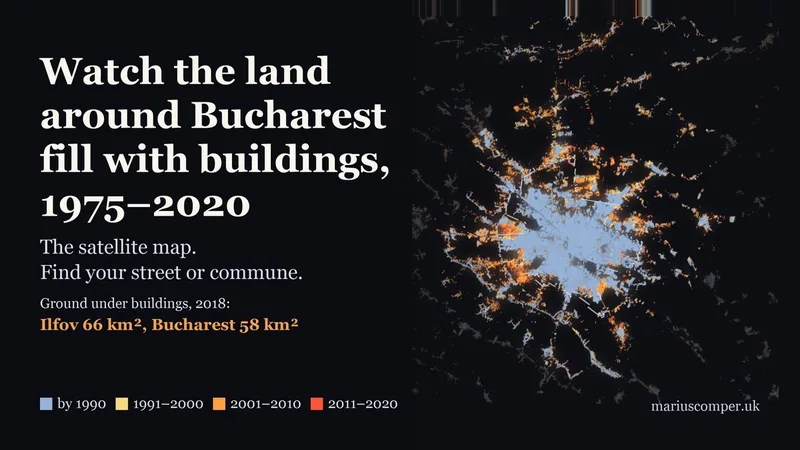
This map compares counties and the capital, not every town or village. Other projects work at locality level, count unoccupied homes or trace new construction. An extra building does not automatically mean an extra resident.
From county to locality
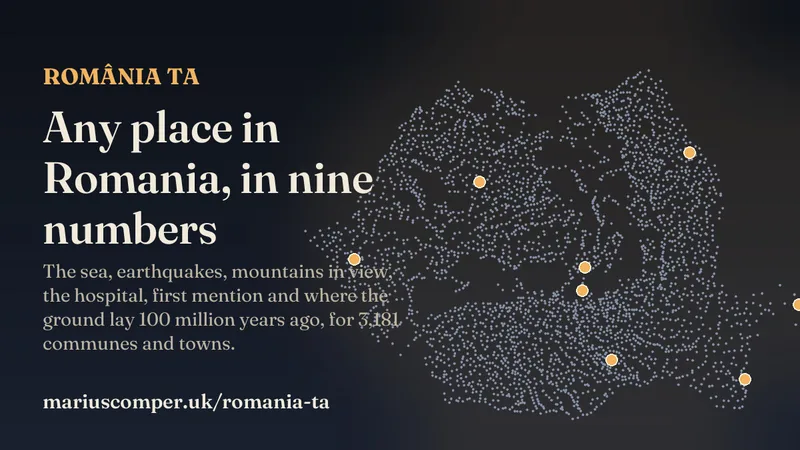
Find a population, year or story
The collection brings together censuses, migration, births, ages, settlements and housing. Each project states what it counts and for which period.