What the line measures
Each point is the annual global mean difference from 1951–1980. The 2024 value was 1.29 °C; in 2025 it was 1.19 °C. This series tracks the global mean, not the weather in one town.
Global measurements · 1880–2025
In 1880, the global mean was 0.18 °C below the reference period. In 2025, it was 1.19 °C above it. Follow NASA’s series, then explore rain, drought, storms and seasons.
NASA GISS · GISTEMP v4
Annual global mean for land and ocean surface temperature, relative to 1951–1980.
The series uses column J-D in the GISTEMP v4 table. Anomalies are relative to the 1951–1980 mean; they are not the planet’s absolute temperature. The incomplete 2026 row is omitted. NASA GISS, source table.
Each point is the annual global mean difference from 1951–1980. The 2024 value was 1.29 °C; in 2025 it was 1.19 °C. This series tracks the global mean, not the weather in one town.
A global mean does not tell you whether it will rain on your street or predict one day’s weather. The projects below measure distinct things: warm nights, rainfall, drought, floods and seasons.
Some projects follow one night, one street or one river. Each result depends on the place, period and unit in its source.
Projects in this collection use observations, models and records to answer different questions. Open each source before comparing places or using a value to make a decision.
Climate and weather · 41 projects
Search titles, descriptions and topic terms, or choose a theme.
41 projects
↑ Back to the experienceTry a broader term or reset the search.
Weather phenomena
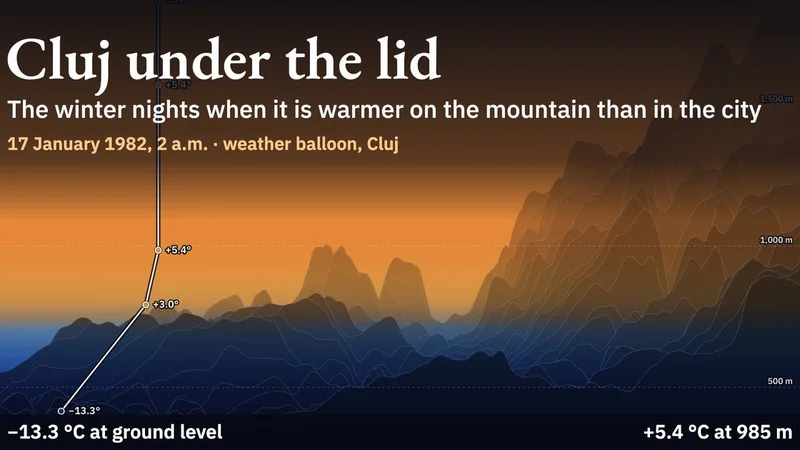
On 34.5% of the winter nights measured by the Cluj weather balloon between 1957 and 2012, the air at 1,500 m above sea level was warmer than the air at ground level. Every night, on the real relief, up to 2025. In Romanian and English.
Seasons
The sky gives the year four fixed points: two solstices and two equinoxes. People decided the rest: two seasons in Iceland’s old calendar, three in ancient Egypt, six in India, 24 solar terms in China and 72 in Japan’s old almanac. The page draws 21 calendars as rings of one year, shows why there are seasons at all, where the four words come from in 64 languages, and what the oldest text found says for eighteen stories about the turning year.
Long-term climate
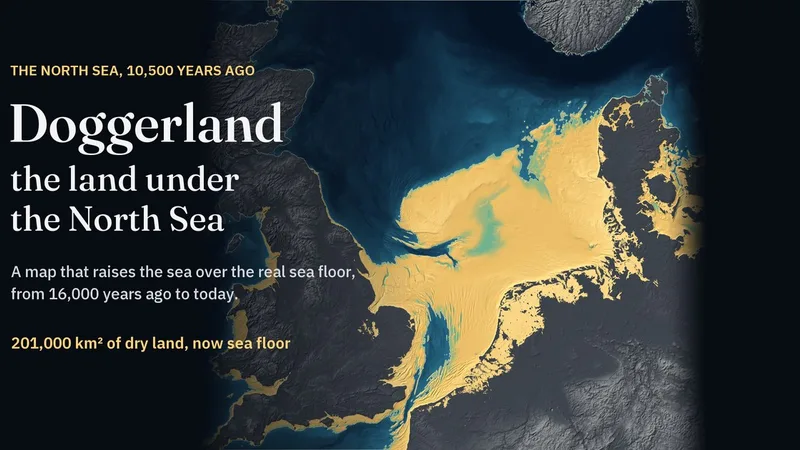
Doggerland joined Britain to Denmark and the Netherlands until the sea drowned it. A relief map of today’s sea floor, with 1,873 river channels, lakes and other features mapped beneath it, and the computed shore of any moment since 16,000 years ago. For each North Sea town, it shows how far away the shore was 10,500 years ago.
Rivers, rain and floods
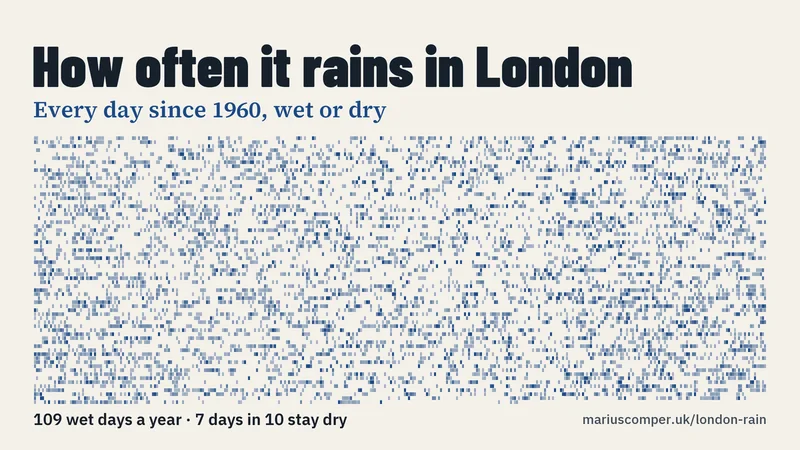
At Heathrow it rains, 1 mm or more, on three days in ten: 109 days a year. Paris, measured at Orly, gets the same; New York gets twice the rain on fewer wet days. Every day from 1 January 1960 to 31 August 2026 is one mark on a wall of days, any date can be followed year by year, and with a year of birth the page counts the birthdays it rained on.
Rivers, rain and floods
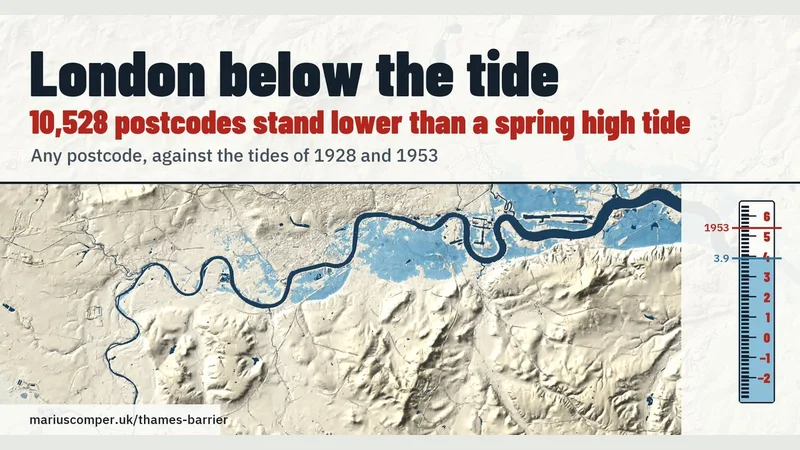
At 10,528 of Greater London's 177,041 postcodes the ground is lower than an ordinary spring high tide at London Bridge (3.9 m above Ordnance Datum). Any postcode set on a tide staff beside the levels of 1928 and 1953, on the city's laser-surveyed relief, and the Thames Barrier's 221 closures counted winter by winter.
Long-term climate
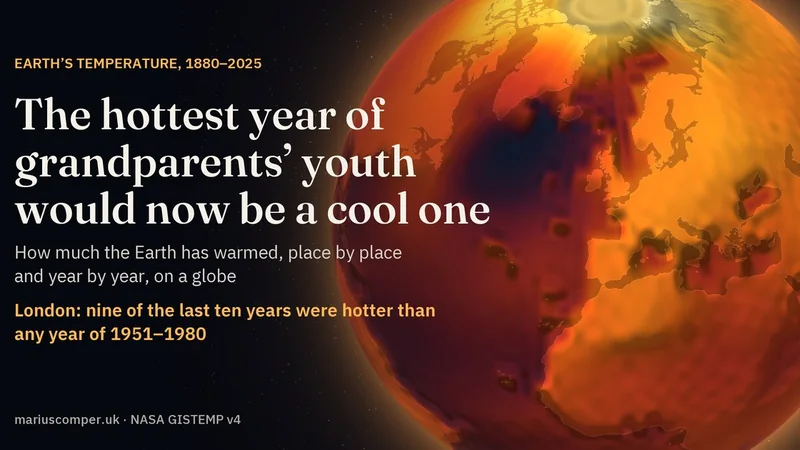
NASA’s temperature record on a globe, year by year from 1880 to 2025. Around London, nine of the last ten years were warmer than 1959, the hottest year between 1951 and 1980. With the numbers for 6,552 towns and cities and a family’s birth years. In Romanian and English.
Rivers, rain and floods
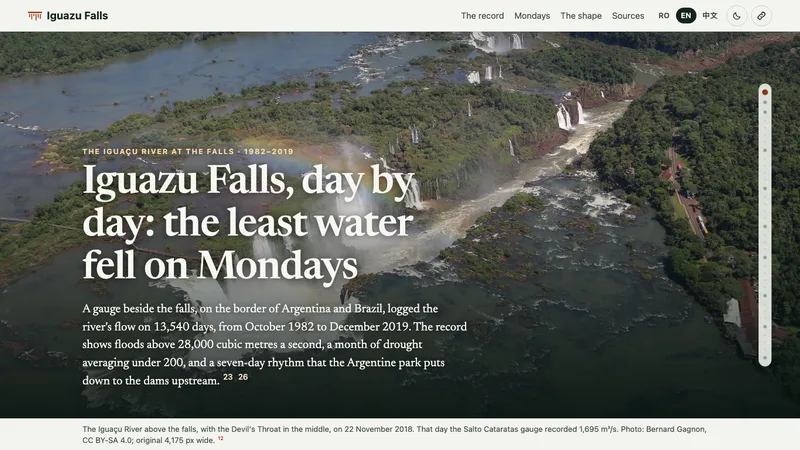
The flow of the Iguaçu River at the falls on 13,540 days between 1982 and 2019: floods above 28,000 m³/s, a month of drought averaging under 200, and a seven-day rhythm. With a day of the reader's choosing. In Romanian, English and Chinese.
Rivers, rain and floods
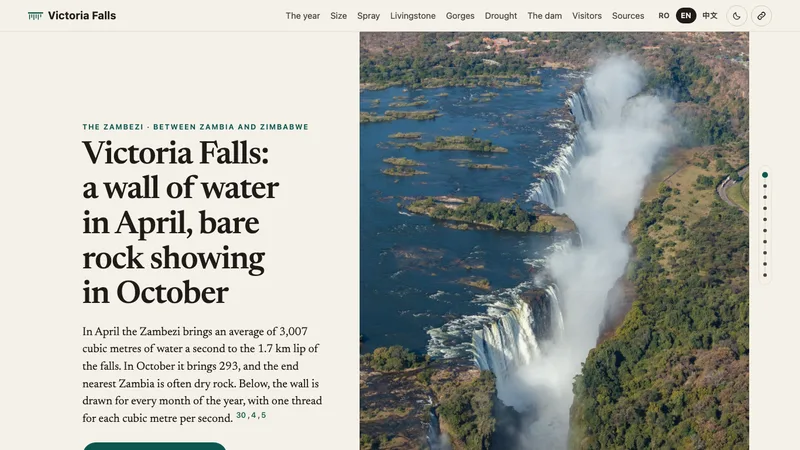
How much water goes over Victoria Falls in each month of the year: on average 3,007 m³/s in April and 293 in October. The wall drawn thread by thread, dated photographs, Devil's Pool, the lunar rainbow and the 2019 drought. In Romanian, English and Chinese.
Rivers, rain and floods
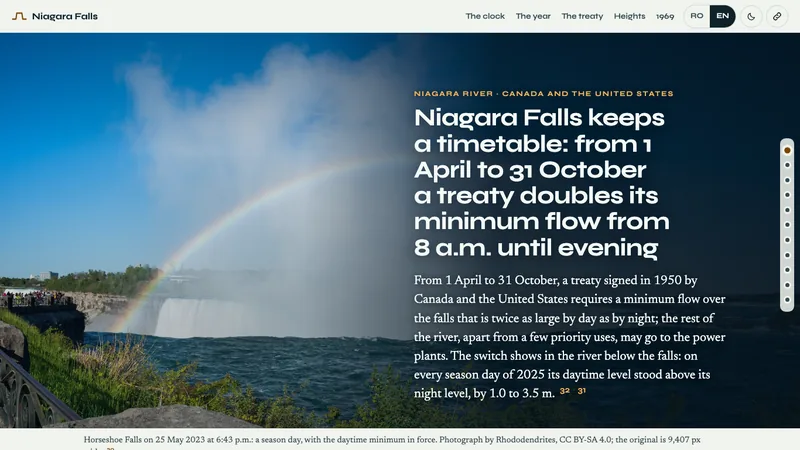
A 1950 treaty sets the minimum flow over Niagara Falls for every hour of the year. In 2025 the river below the falls stood higher by day than by night on every season day. A clock shows the schedule in force now. In Romanian and English.
Rivers, rain and floods
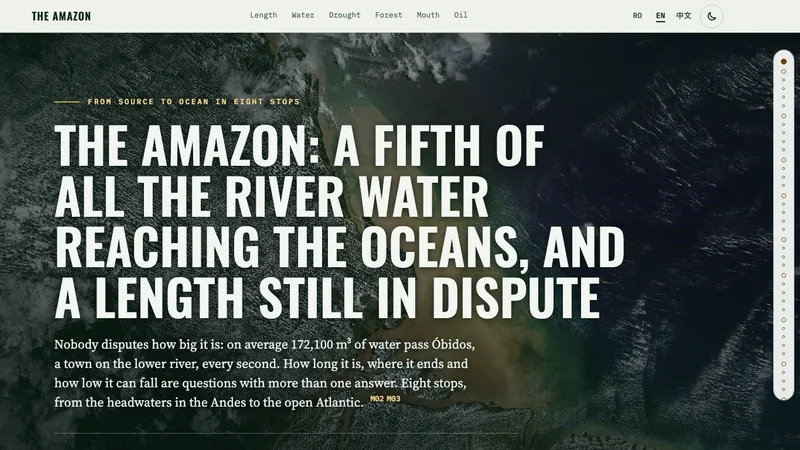
How long the Amazon is, how much water it carries, how far the Rio Negro fell at Manaus and how much forest is cleared in a year: eight chapters with drawings to scale and a source for every number. In Romanian, English and Chinese.
Rivers, rain and floods
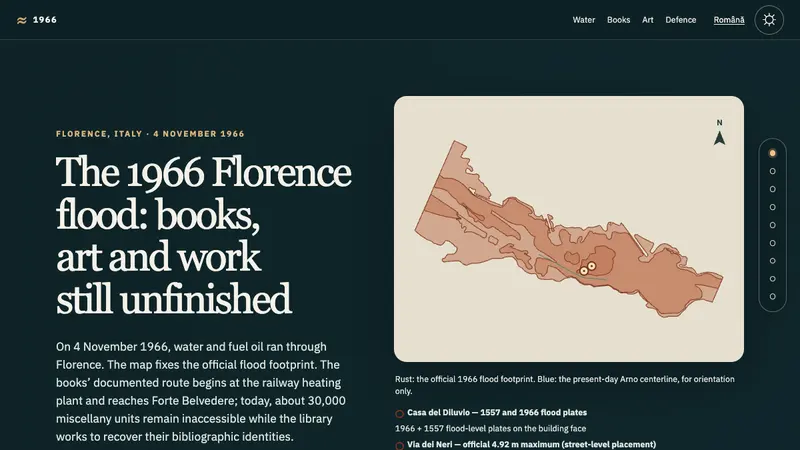
4 November 1966: the Arno overflows, 35 official dead, a million bibliographic units hit at the BNCF. Cimabue's Crucifix at 60%, the book hospital from station to Forte Belvedere and 30,000 units still unreachable. In Romanian and English.
Weather phenomena
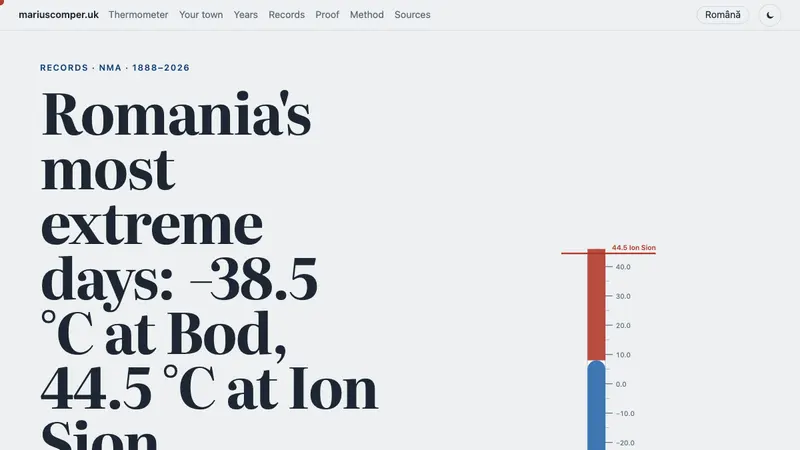
How hot and how cold Romania has ever been: 44.5 °C at Ion Sion on 10 August 1951 and −38.5 °C at Bod on 25 January 1942. Both official, with day and proof — plus your town on the same scale.
Long-term climate
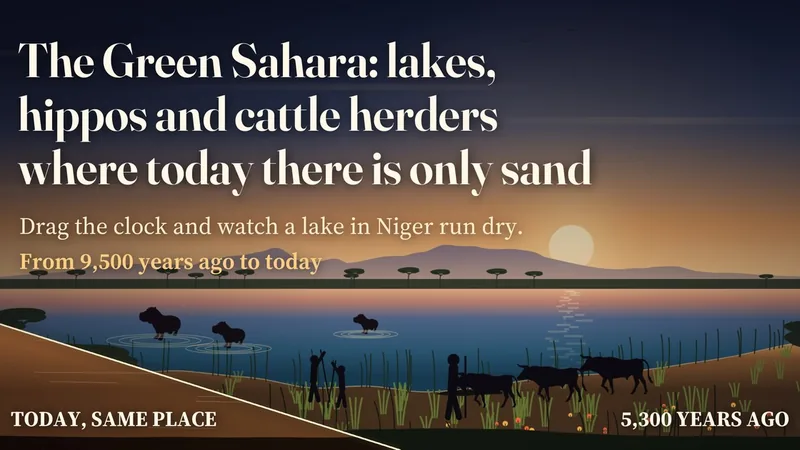
On the shore of a lake in Niger, about 200 graves. Move the clock from 7700 BCE to today and watch the water, the animals and the people go, then watch the rain leave the Sahara on a map: it did not stop everywhere at once.
Long-term climate
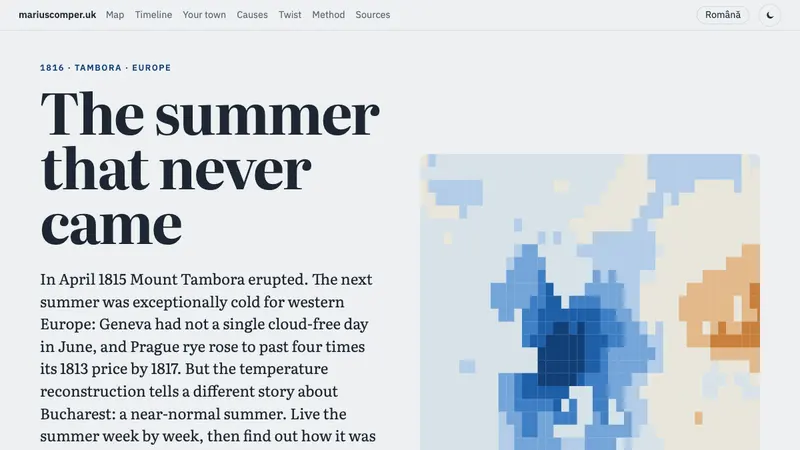
Tambora killed the summer of 1816 in Western Europe — but the reconstruction shows Romania near normal. Pick your town and see how far below average its summer fell.
Heat and heavy rain
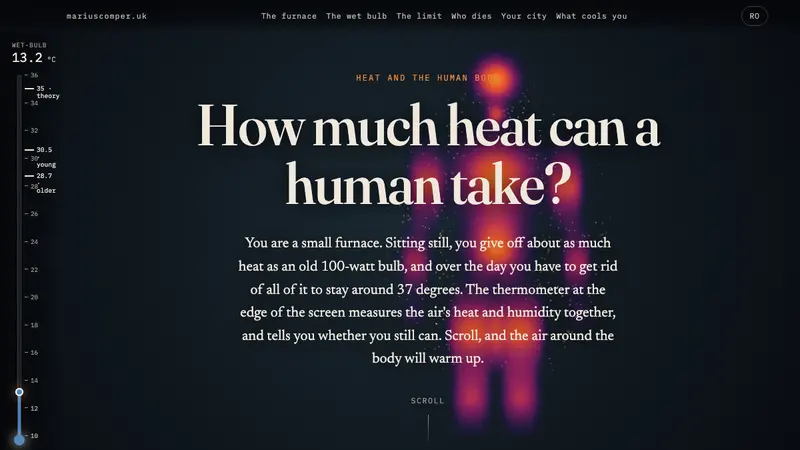
In the lab, bodies stopped coping at about 31 °C wet-bulb in young adults and 29 in older ones, well below the famous 35. Climb the thermometer, see who heat kills, and where your city's hottest hour lands.
Weather phenomena
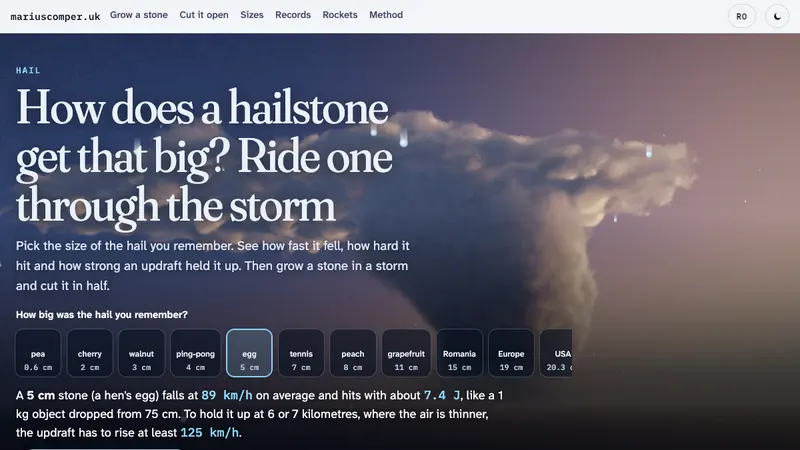
Pick the size of the hail you remember and see how fast it fell and how hard it hit. Then grow a stone in an updraft, cut it in half, and learn what is known — and what is not — about anti-hail rockets. In Romanian and English.
Rivers, rain and floods
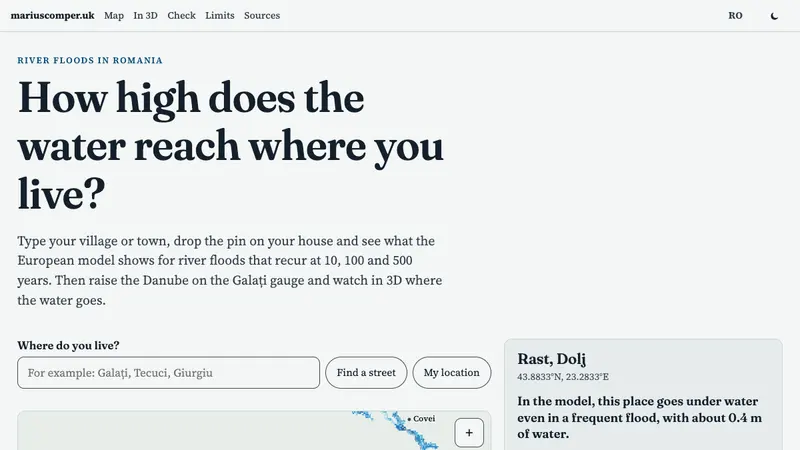
Type your village or town, drop the pin on your house and see the European flood model: 10-, 100- and 500-year floods on the Danube, Siret and Prut. Then raise the Danube at the Galați gauge and watch in 3D where the water goes. In Romanian and English.
Seasons
Since 812, emperors, courtiers and monks have noted the day they went out to see Kyoto's cherry trees in flower. 838 springs, more than half known from parties under the trees, on one chart. Guess the day for your year. The trees now bloom 11 days earlier, and the record is no longer 2021.
Rivers, rain and floods
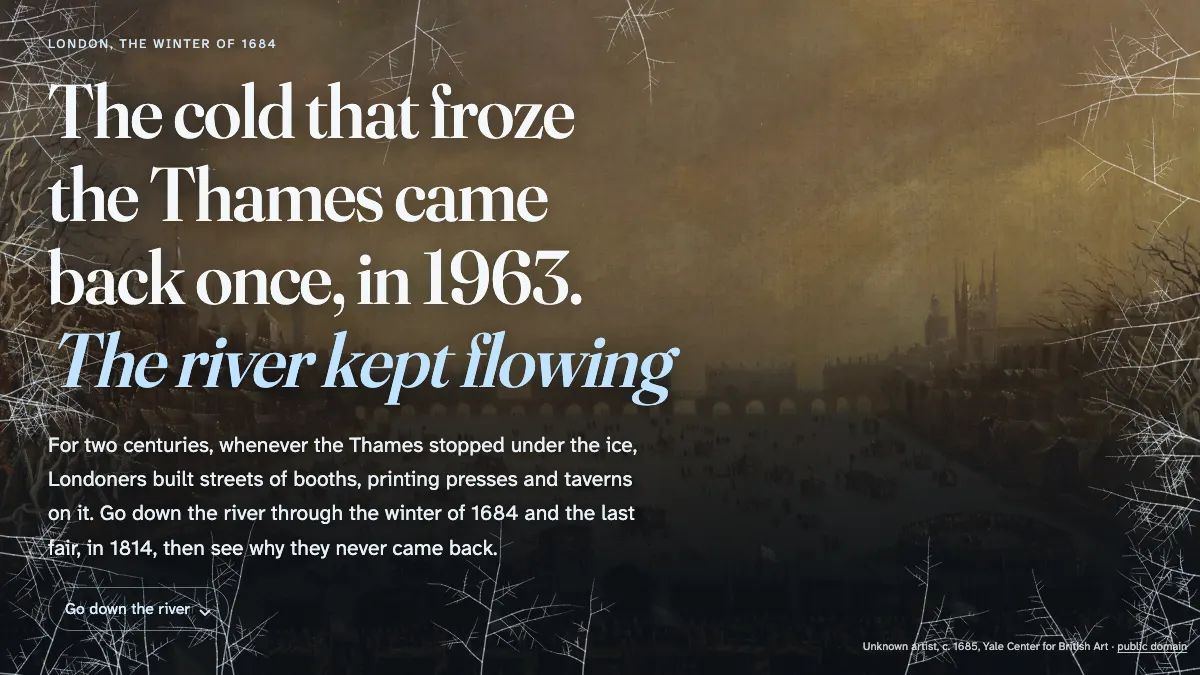
Streets of booths, printing presses and taverns on the frozen river, from Evelyn's diary and the accounts of 1814. The cold that froze the Thames came back once, in 1963; with the old bridge gone, the river kept flowing.
Weather phenomena
Divide the seconds by three for kilometres, and heard thunder means the storm can strike. With a map of your town.
Rivers, rain and floods
About a month in an average year: three weeks in flood, two months in drought. Send a drop down the Danube, from the Black Forest to Sulina, on a clock built from measured current speeds.
Weather phenomena
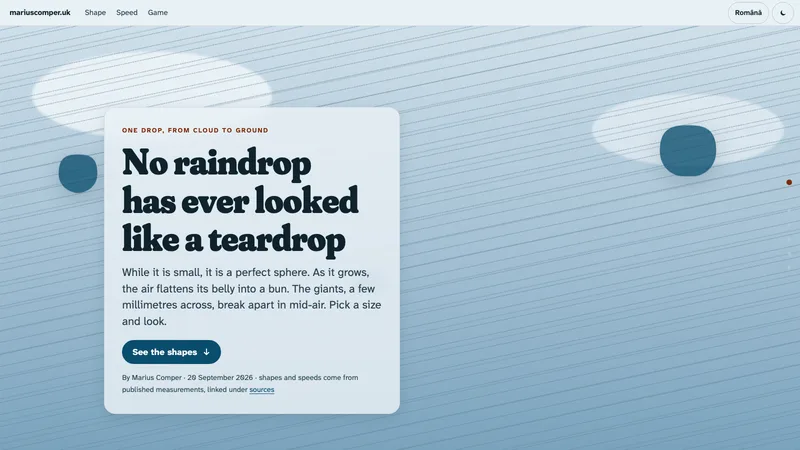
No raindrop looks like a teardrop: small it is a sphere, large a flattened bun falling at 31 km/h, and the giants break up in mid-air. Pick a diameter, see the shape and speed, then play eight true-or-false sentences.
Rivers, rain and floods
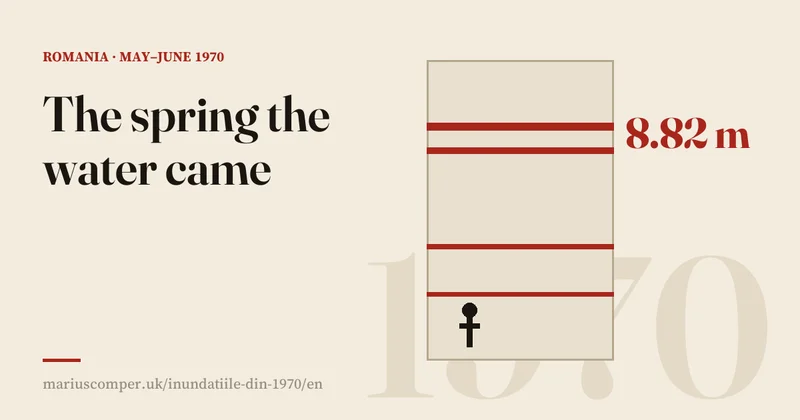
The rain, the drowned counties, the rebuild — and the dead have no single number.
Long-term climate
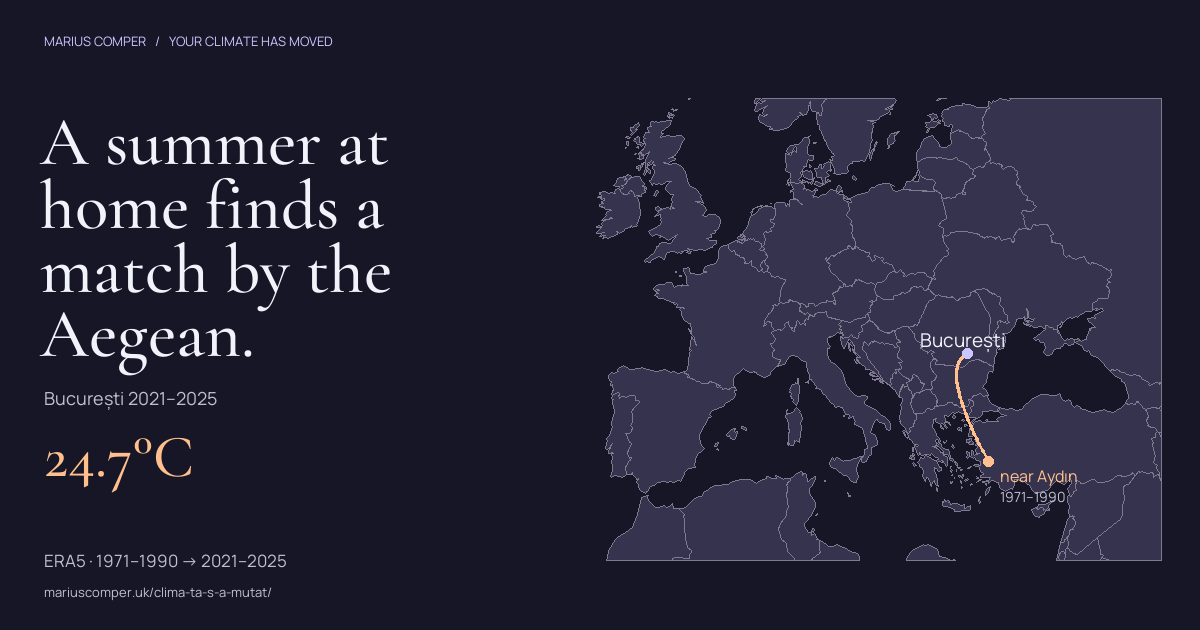
Compare your Romanian locality’s summers with Europe in 1971–1990. An interactive ERA5 atlas of temperature and rainfall.
Rivers, rain and floods
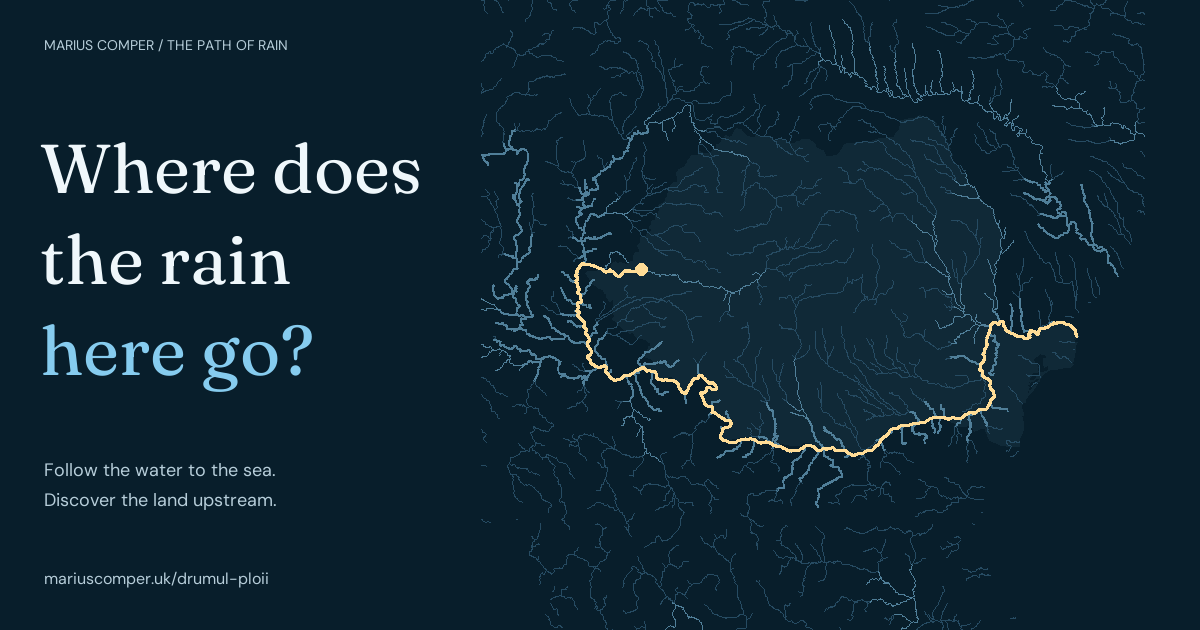
At Arad, the Mureș flows west: through the Tisza, then into the Danube and the Black Sea. Search for a river or pick a place to follow the water, then discover the land that feeds it.
Rivers, rain and floods
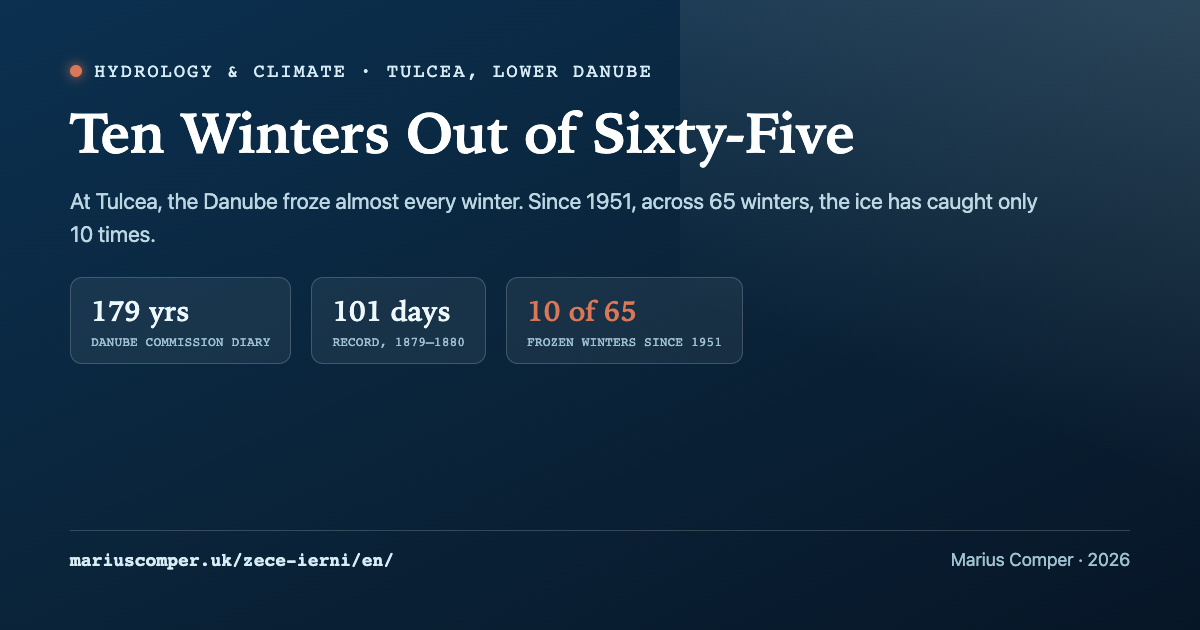
At Tulcea, ice on the Danube was logged for 180 winters in a row: four winters in five froze before 1950, 10 in 66 after. Type your family's birth years and the river replays every winter of your lives.
Long-term climate
Seventeen million years on one slider: the Badenian sea, the giant lake, the drying that emptied it and today's Black Sea, over a faintly visible Romania, with every county cut along the maps.
Long-term climate
The core aligns 834 stops with ice age, air age and measured CO₂, from 137 years to nearly 800,000 years.
Heat and heavy rain
In 1900, the Tube was 14°C. After 125 years of braking, 500 GWh of annual heat have saturated the clay mantle, turning the earth into a 30°C radiator.
Heat and heavy rain
A systematic synthesis of epidemiological evidence on ambient heat during pregnancy. How local climate, humidity, and gestational timing shape risk thresholds at 30.55°C, 34.11°C, and 39.07°C.
Seasons
Is the Transfagarasan open now? Opening and closing dates 2015–2026, Transalpina comparison, altitude profile, fuel, the Balea cable car, and what to do when it's closed.
Rivers, rain and floods
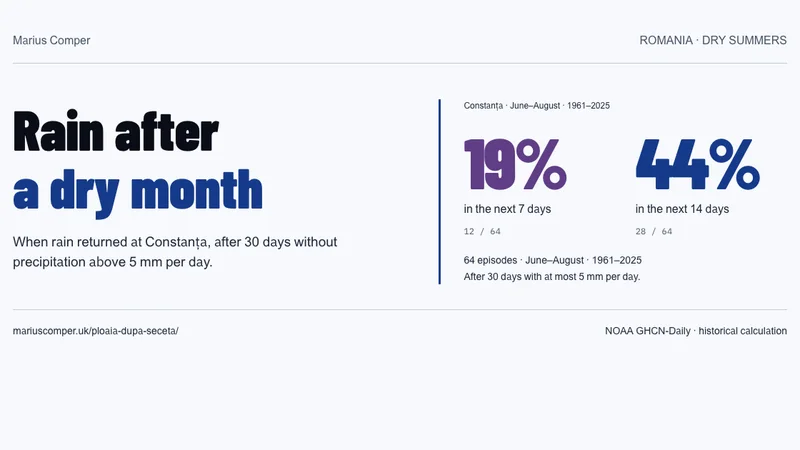
At Constanța, after 30 days without rain above 5 mm per day, the threshold was exceeded within the next 7 days in 12 of 64 summer episodes. Explore the record and compare stations.
Rivers, rain and floods
Daily Danube flow at Orșova since 1840, 183 years: between June and September no day had fallen under 1,440 m³/s. In 2026, INHGA bulletins give 1,300 in August and 1,250 in September. Enter a flow from the news and see how often the river has been that low.
Rivers, rain and floods
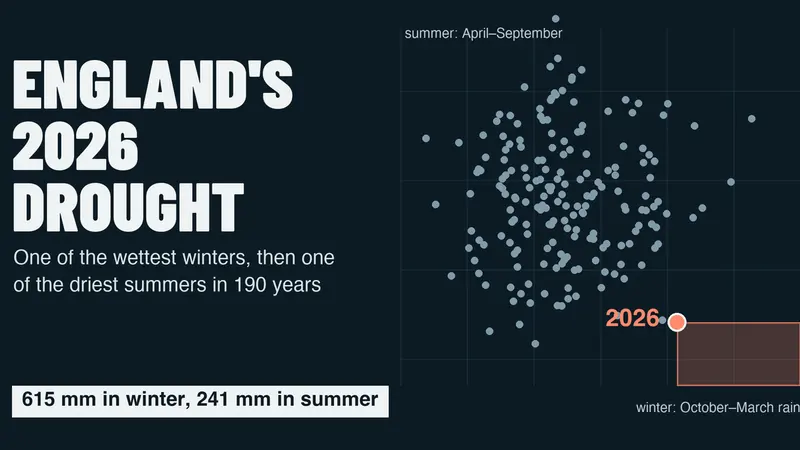
190 years of English rainfall: winter 2025–26 among the wettest, summer 2026 among the driest.
Heat and heavy rain
Tropical nights (≥ 20°C) are warming faster than daytime highs. An interactive explainer about recovery, Europe, Bucharest on the chart and mortality.
Heat and heavy rain
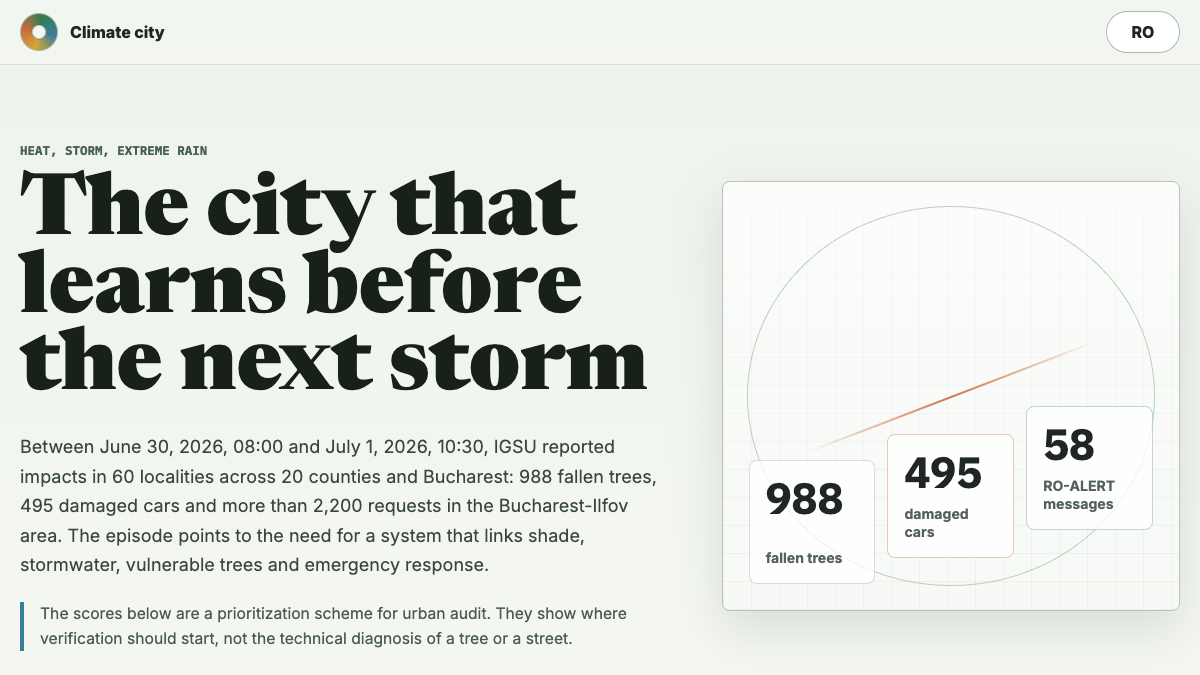
An interactive matrix about heat, storms, extreme rain and the data that can guide Bucharest's response.
Long-term climate
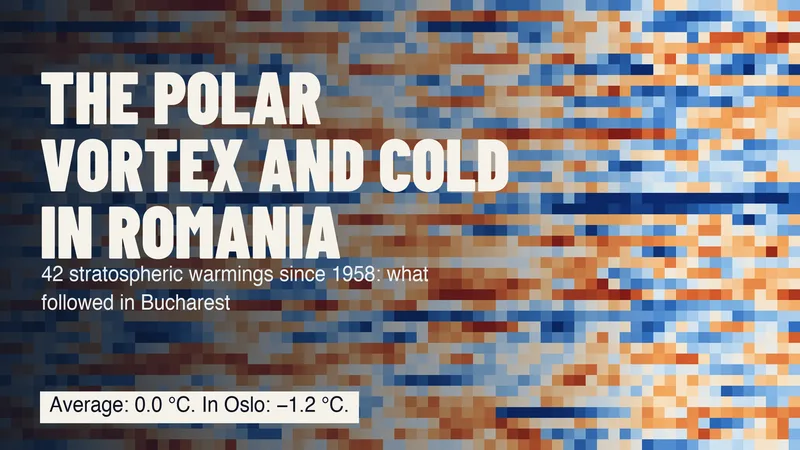
Every stratospheric warming since 1958, one row of Bucharest days.
Long-term climate
Search your commune or county and see on 3D terrain how much energy the sun yields there, month by month: the 2005–2020 climate mean for a 1 kWp reference system across all 3,181 communes. Every commune is a column: height is the month, colour is the year. In Romanian and English.
Heat and heavy rain
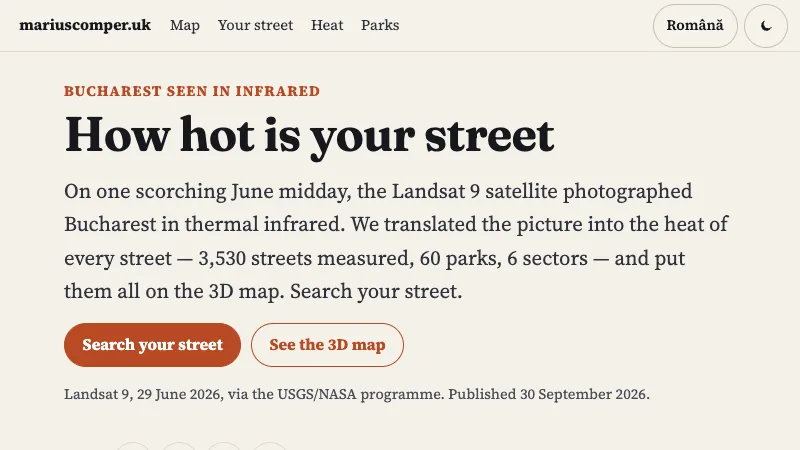
Type a Bucharest street and see how hot the satellite saw it at midday, in 3D: 3,532 streets measured from Landsat 9, 60 parks and 6 sectors, each street with its own mean.
Seasons
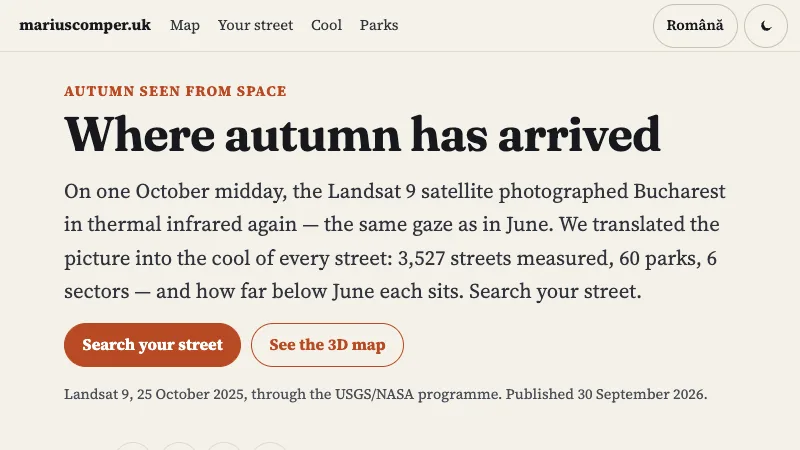
Type a Bucharest street and see how cold the satellite saw it on an October midday, in 3D: 3,530 streets measured from Landsat 9, 60 parks and 6 sectors — each street with its difference from June.
Seasons
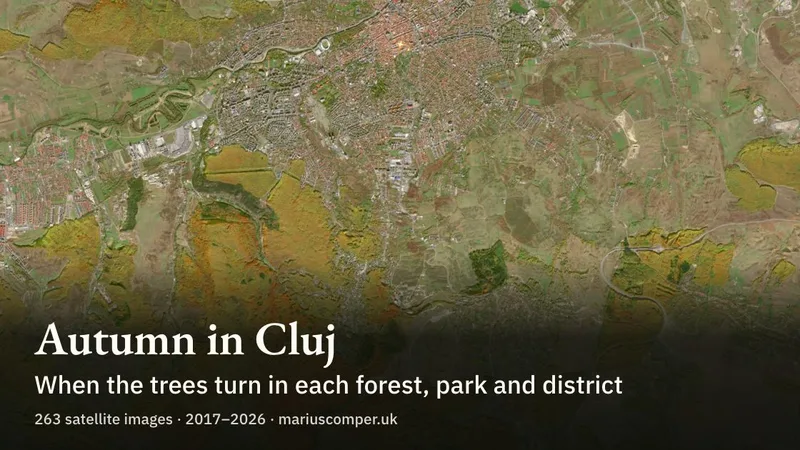
The forests around Cluj, in Transylvania, lose half of their summer green around 22 October; the Botanical Garden almost a week later. A map of that day for 60 forests, parks and districts, from 263 Sentinel-2 images. In Romanian and English.
This collection brings together relevant projects from the site’s library. Each entry has a title, a description and a link to its available edition. The complete projects carry their sources and evidence limits.
Reviewed · Collection as text
Column J-D: annual mean anomaly in degrees Celsius relative to 1951–1980.
This is a regional series and is not directly comparable with NASA’s global mean.