Archaeology · the Gumelnița culture on the Lower Danube
Archaeology in Romania: what 406 dates reveal about Gumelnița
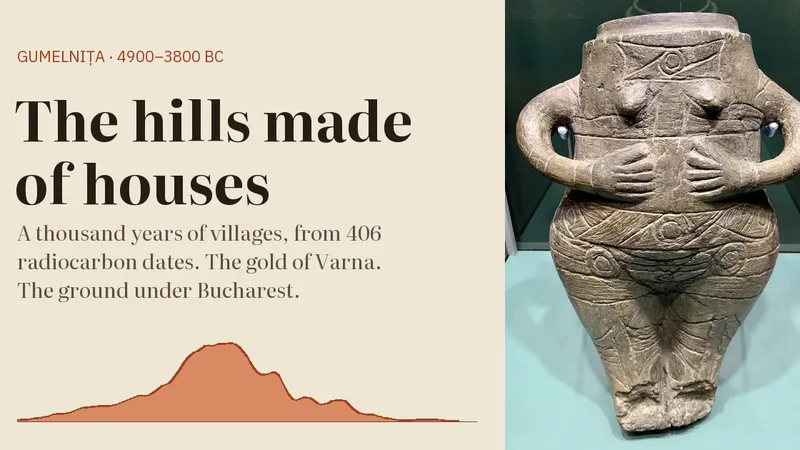
A set of 406 radiocarbon dates becomes a probability curve. Change the 10-year bin and site to see what the curve measures about the past.
406 dates · 59 sites · 131 ten-year bins
All archaeology projects ↓IntCal20 · Lower Danube
Where does the curve rise?
Paper estimate4,394 BCEHighest plotted bin: 4,390 BCE
Open the table of 131 bins
| 10-year bin | All sites | Pietrele |
|---|---|---|
| 5,050 BCE | 0% | 0% |
| 5,040 BCE | 1% | 0% |
| 5,030 BCE | 1% | 0% |
| 5,020 BCE | 1% | 0% |
| 5,010 BCE | 1% | 0% |
| 5,000 BCE | 2% | 0% |
| 4,990 BCE | 2% | 0% |
| 4,980 BCE | 2% | 0% |
| 4,970 BCE | 3% | 0% |
| 4,960 BCE | 3% | 0% |
| 4,950 BCE | 4% | 0% |
| 4,940 BCE | 4% | 0% |
| 4,930 BCE | 5% | 0% |
| 4,920 BCE | 6% | 0% |
| 4,910 BCE | 7% | 0% |
| 4,900 BCE | 8% | 0% |
| 4,890 BCE | 9% | 0% |
| 4,880 BCE | 9% | 0% |
| 4,870 BCE | 10% | 0% |
| 4,860 BCE | 11% | 0% |
| 4,850 BCE | 12% | 0% |
| 4,840 BCE | 13% | 0% |
| 4,830 BCE | 15% | 0% |
| 4,820 BCE | 16% | 0% |
| 4,810 BCE | 17% | 0% |
| 4,800 BCE | 18% | 0% |
| 4,790 BCE | 18% | 0% |
| 4,780 BCE | 19% | 0% |
| 4,770 BCE | 20% | 0% |
| 4,760 BCE | 20% | 0% |
| 4,750 BCE | 20% | 0% |
| 4,740 BCE | 20% | 0% |
| 4,730 BCE | 21% | 0% |
| 4,720 BCE | 22% | 0% |
| 4,710 BCE | 23% | 1% |
| 4,700 BCE | 25% | 1% |
| 4,690 BCE | 27% | 1% |
| 4,680 BCE | 29% | 3% |
| 4,670 BCE | 31% | 5% |
| 4,660 BCE | 32% | 5% |
| 4,650 BCE | 33% | 6% |
| 4,640 BCE | 32% | 6% |
| 4,630 BCE | 33% | 4% |
| 4,620 BCE | 36% | 4% |
| 4,610 BCE | 38% | 7% |
| 4,600 BCE | 42% | 13% |
| 4,590 BCE | 46% | 13% |
| 4,580 BCE | 47% | 16% |
| 4,570 BCE | 49% | 15% |
| 4,560 BCE | 54% | 12% |
| 4,550 BCE | 60% | 16% |
| 4,540 BCE | 66% | 34% |
| 4,530 BCE | 73% | 46% |
| 4,520 BCE | 80% | 44% |
| 4,510 BCE | 84% | 41% |
| 4,500 BCE | 87% | 46% |
| 4,490 BCE | 90% | 56% |
| 4,480 BCE | 92% | 58% |
| 4,470 BCE | 96% | 55% |
| 4,460 BCE | 97% | 55% |
| 4,450 BCE | 96% | 57% |
| 4,440 BCE | 97% | 64% |
| 4,430 BCE | 99% | 77% |
| 4,420 BCE | 98% | 62% |
| 4,410 BCE | 99% | 57% |
| 4,400 BCE | 100% | 60% |
| 4,390 BCE | 100% | 63% |
| 4,380 BCE | 98% | 60% |
| 4,370 BCE | 94% | 61% |
| 4,360 BCE | 89% | 78% |
| 4,350 BCE | 83% | 99% |
| 4,340 BCE | 75% | 89% |
| 4,330 BCE | 68% | 61% |
| 4,320 BCE | 62% | 34% |
| 4,310 BCE | 60% | 21% |
| 4,300 BCE | 60% | 23% |
| 4,290 BCE | 61% | 39% |
| 4,280 BCE | 62% | 56% |
| 4,270 BCE | 62% | 54% |
| 4,260 BCE | 59% | 39% |
| 4,250 BCE | 51% | 23% |
| 4,240 BCE | 43% | 14% |
| 4,230 BCE | 34% | 9% |
| 4,220 BCE | 29% | 7% |
| 4,210 BCE | 27% | 6% |
| 4,200 BCE | 29% | 7% |
| 4,190 BCE | 30% | 10% |
| 4,180 BCE | 31% | 14% |
| 4,170 BCE | 29% | 10% |
| 4,160 BCE | 26% | 6% |
| 4,150 BCE | 23% | 4% |
| 4,140 BCE | 22% | 5% |
| 4,130 BCE | 22% | 7% |
| 4,120 BCE | 24% | 8% |
| 4,110 BCE | 26% | 7% |
| 4,100 BCE | 27% | 7% |
| 4,090 BCE | 27% | 9% |
| 4,080 BCE | 27% | 9% |
| 4,070 BCE | 26% | 8% |
| 4,060 BCE | 22% | 7% |
| 4,050 BCE | 17% | 4% |
| 4,040 BCE | 13% | 1% |
| 4,030 BCE | 11% | 0% |
| 4,020 BCE | 9% | 0% |
| 4,010 BCE | 9% | 1% |
| 4,000 BCE | 9% | 1% |
| 3,990 BCE | 8% | 0% |
| 3,980 BCE | 7% | 0% |
| 3,970 BCE | 6% | 0% |
| 3,960 BCE | 5% | 0% |
| 3,950 BCE | 4% | 0% |
| 3,940 BCE | 3% | 0% |
| 3,930 BCE | 2% | 0% |
| 3,920 BCE | 2% | 0% |
| 3,910 BCE | 1% | 0% |
| 3,900 BCE | 1% | 0% |
| 3,890 BCE | 1% | 0% |
| 3,880 BCE | 2% | 0% |
| 3,870 BCE | 2% | 0% |
| 3,860 BCE | 2% | 0% |
| 3,850 BCE | 2% | 0% |
| 3,840 BCE | 3% | 0% |
| 3,830 BCE | 3% | 0% |
| 3,820 BCE | 2% | 0% |
| 3,810 BCE | 2% | 0% |
| 3,800 BCE | 2% | 0% |
| 3,790 BCE | 1% | 0% |
| 3,780 BCE | 1% | 0% |
| 3,770 BCE | 0% | 0% |
| 3,760 BCE | 0% | 0% |
| 3,750 BCE | 0% | 0% |
The supplementary file used here contains 406 dates, 59 sites and 131 bins; the paper also discusses a broader inventory. Calibrated probabilities are summed, normalized and smoothed over 50 years. The paper estimates its peak at 4394 BCE; the highest bin in the file is labelled 4390 BCE. The curve describes the distribution of selected dates, not the number of people or houses.
01 / Beyond the curve
Dates are ranges, not exact days
The series traces changes over several centuries. Each radiocarbon measurement is calibrated as a probability; several years may be plausible for one date. The curve adds those probabilities. A peak does not mean that the most houses were built in one year.
02 / Beyond the curve
What remains in the ground
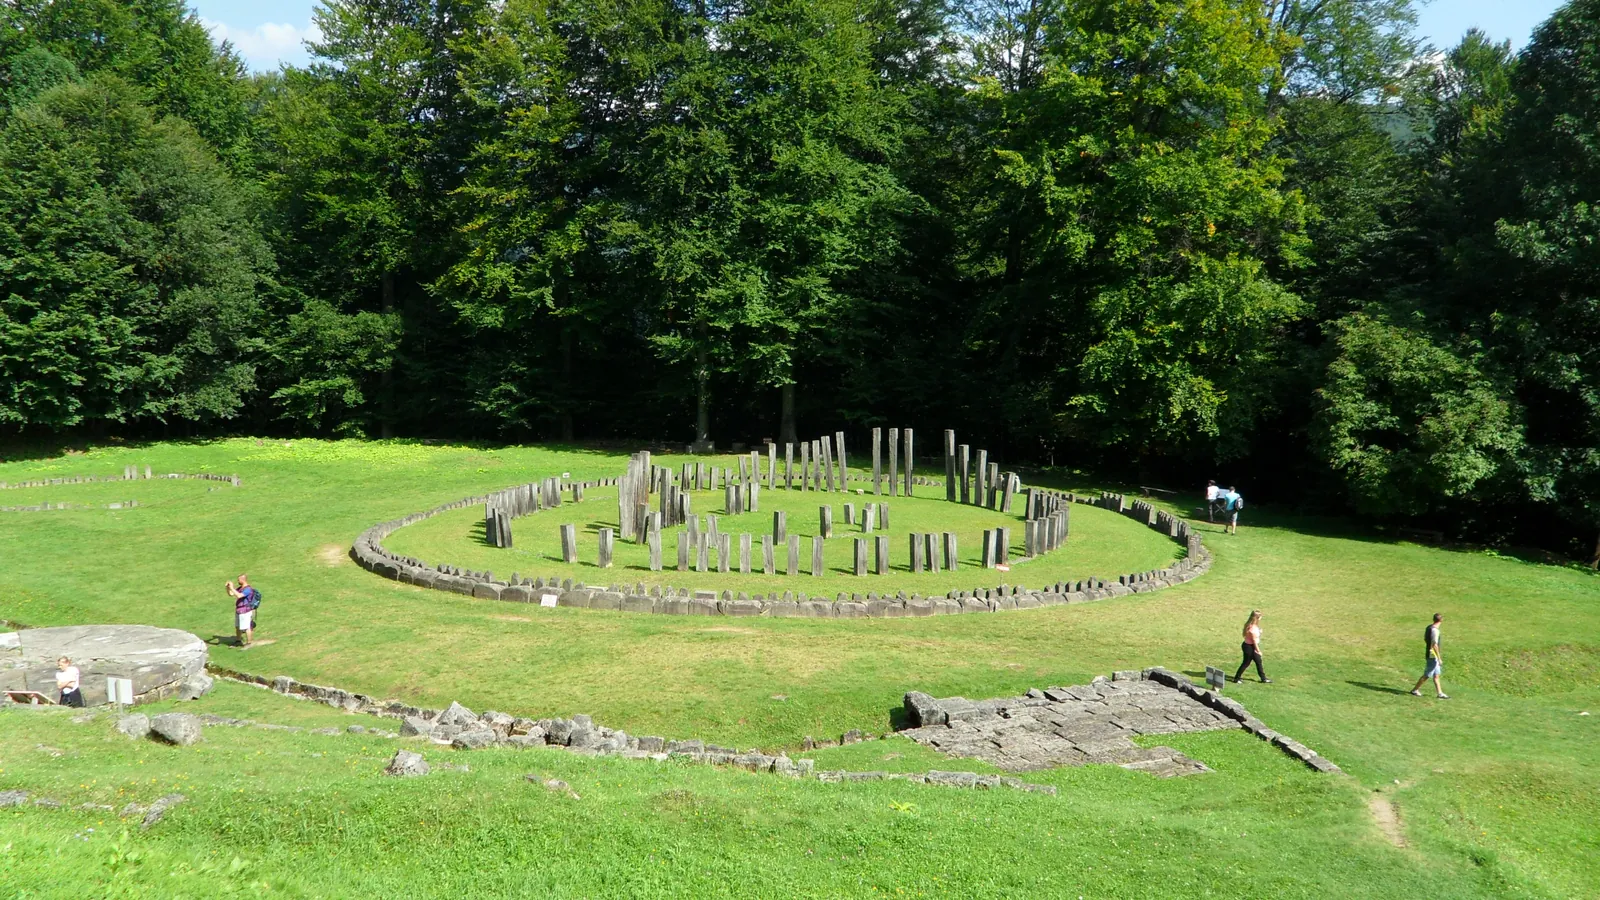
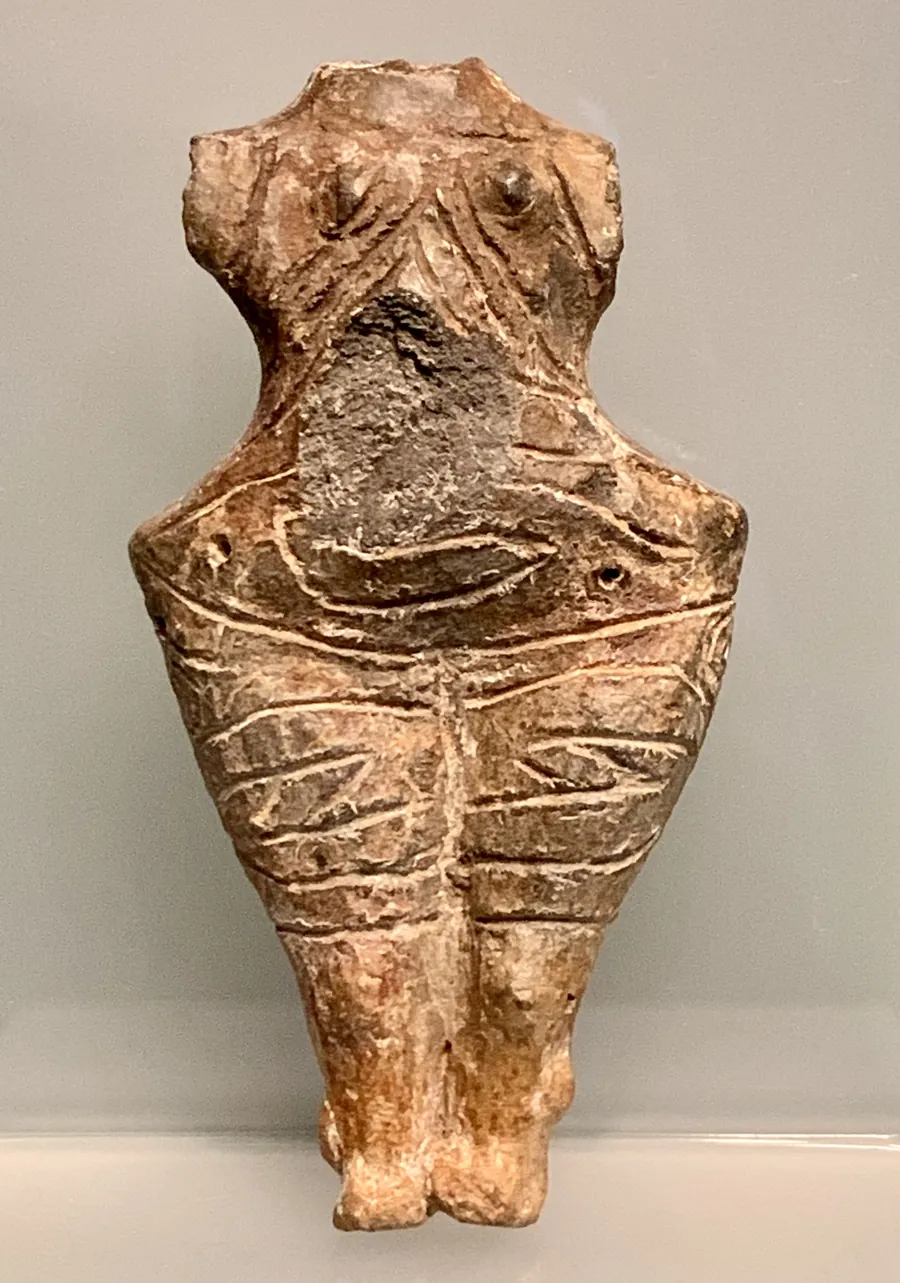
A chronology curve needs sites and objects to make sense. Gumelnița settlements rose into tells as people built on earlier homes. Pottery, burnt houses, food remains and graves preserve different evidence; one figurine cannot tell us what its maker believed.
03 / Beyond the curve
One era, different clocks
Archaeologists can date a layer, an object or organic material found beside it. A date assigned through pottery is not the same as a radiocarbon measurement. The projects below keep their methods and uncertainties separate, so you can see what supports each date.
04 / Beyond the curve
Traces in the ground and in archives
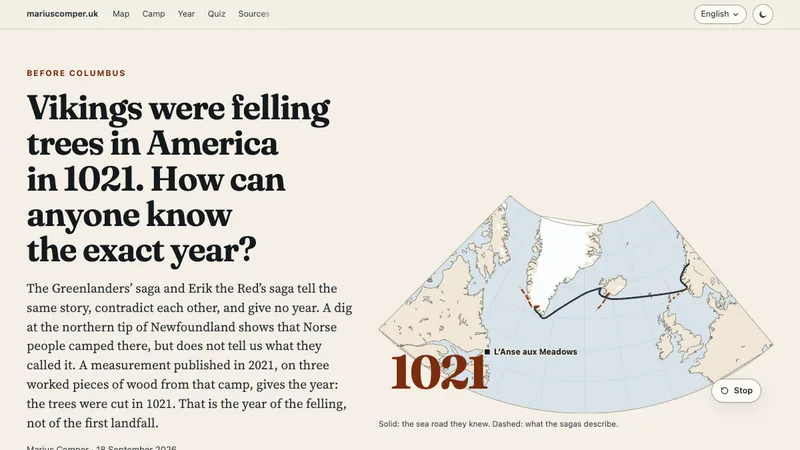
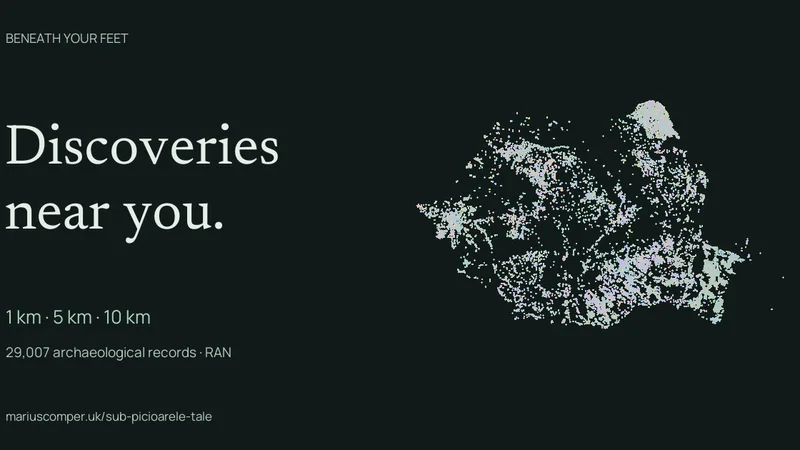
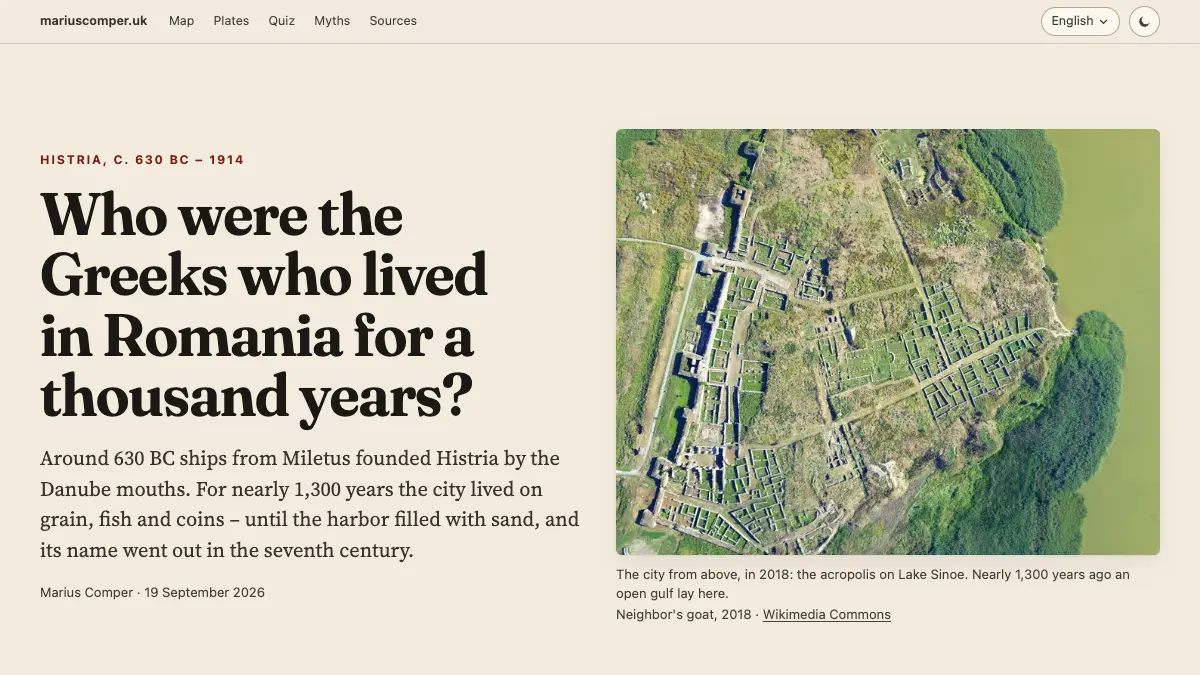
From Romania to other landscapes, the collection follows ruins, roads, fortifications, objects, inscriptions and restorations. Start with a map of nearby discoveries, or choose a site and see what remains, what was moved and what was lost.
Follow the evidence
Choose a discovery or place
The collection ranges from prehistoric settlements to inscriptions, fortresses, maps and restorations. Each project carries its sources and evidence type.